
Energy Research Unit Meteorological Data
07/04/2025: Britwind power generation figures updated 3 March 2025 to 7 April 2025 March Met Summaries now available. The figures are now in place.
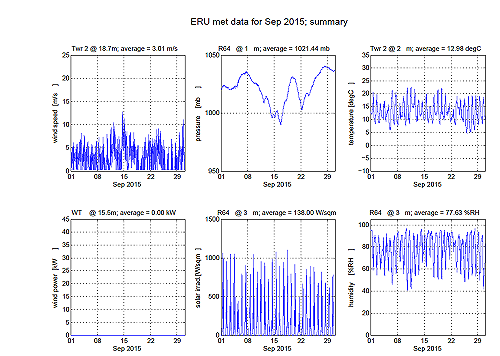
Click image above for all Monthly Summaries
The ERU Test Site is located at the STFC Rutherford Appleton Laboratory (RAL). Meteorological data has been logged by the ERU Met Station at the site since 1987 until 2016, during which time the met station was located at OS Grid Reference SU 47175 85825 / coordinates 447175E 185825N / Latitude 51° 34′ 10″ N and Longitude 001° 19′ 15″ W.
In 2018 the ERU Test Site was relocated a short distance (to OS grid reference SU 47201 85760 / coordinates 447201E 185760N / Latitude 51° 34′ 07.5″ N and Longitude 001° 19′ 13.4″ W) and new met instruments and a logger have been installed adjacent to the ERU Control Room (Building R111). The met station uses Minimet instruments and a DataHog logger supplied by Skye Instruments, and measures data at one minute intervals. The met logger is permanently connected to a PC running a Matlab program which generates graphs updated at five minute intervals, and stores data on an STFC server.

Measurements of wind speed and direction are made using instruments on a met tower (Twr 4) at 18m above ground level; while solar irradiance, atmospheric pressure, relative humidity, temperature and rainfall are measured near to ground level.
Choose an instrument from the list to display a graph of recent data for the last 2 days, updated every five minutes, or see the graphs for all the instruments on one page.
The historic 1 minute data have been archived and may be made available for research purposes upon request. Summary charts are available from January 2010 to July 2016, and from January 2018 onwards.
The original purpose for establishing the ERU met station was to aid our research into wind energy and in particular the optimisation of wind turbine design and operation. More recently met data has been provided data to other parts of Harwell Campus for scientific use, including ISIS Health and Safety, Diamond Light Source Ltd, and UKAEA.

Graphs of “real time” data have been displayed on this website since 1999, and are used by staff for various scientific purposes, but also for general interest.
For further information please contact Peter Holt.
Met Office: "Will it rain today?" for our area
